


As geopolitical tensions escalate in the Strait of Hormuz, the global logistics architecture is undergoing its most profound realignment in decades. What was once a seamless network of maritime chokepoints is rapidly fragmenting into a patchwork of overland corridors, multimodal diversions, and costly alternatives.
1. A Precarious Truce: The Current Geopolitical Landscape
The tenuous ceasefire between the United States and Iran—barely two weeks old—is already showing signs of collapse. On April 18, US Marines forcibly seized an Iranian-flagged cargo ship attempting to breach the American naval blockade near the Strait of Hormuz, prompting Iranian drone retaliation against US military vessels .

Tehran has since rejected participation in a second round of talks in Islamabad, with Foreign Ministry spokesman Esmail Baghaei accusing Washington of “lacking seriousness” about diplomatic efforts . While Iranian Parliament member Ebrahim Azizi has signaled openness to continued negotiations, he emphasized “non-negotiable red lines” . The ceasefire expires on April 22, and the United Kingdom Maritime Trade Operations continues to rate the security situation in the Strait at a “critical” level, warning of navigation interference, blockade enforcement, mines, and lingering kinetic threats .
US President Donald Trump has threatened to destroy “every bridge and power plant in Iran” should Tehran reject American terms, while Iran has countered by vowing to target power stations and desalination plants of Gulf neighbors hosting US military bases . The impasse has already claimed at least 3,300 lives in Iran and 13 US service members .
2. The Strait of Hormuz: A Chokepoint That Moves the World
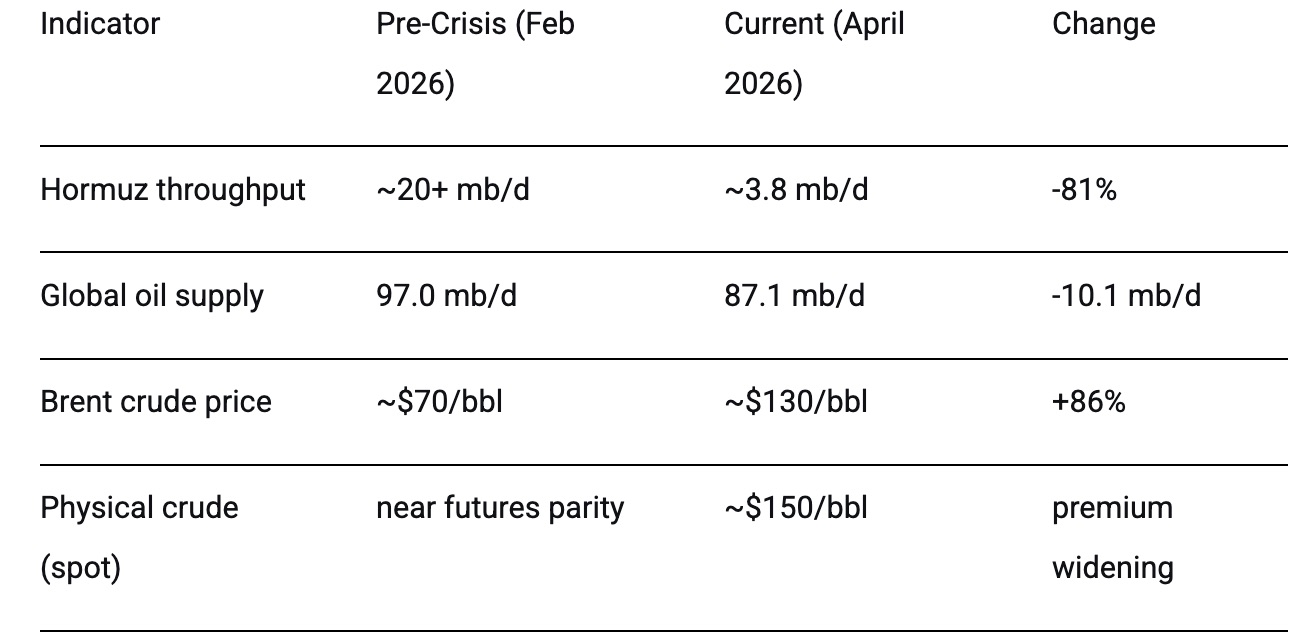
The Strait of Hormuz—a 21-mile-wide waterway between the Persian Gulf and the Gulf of Oman—has long been the world’s most critical oil transit artery. Approximately 20 million barrels per day (approximately one-fifth of global petroleum consumption) typically passes through this narrow channel .
Today, that flow has been reduced to a trickle. According to the International Energy Agency’s April 2026 Oil Market Report, total oil, gas, and refined product loadings passing through Hormuz in early April stood at just 3.8 million barrels per day—less than one-fifth of the pre-crisis volume of over 20 million barrels per day recorded in February .
The macroeconomic impact has been staggering:
For the United States, the crisis presents a dual challenge: maintaining pressure on Iran while managing domestic fuel prices that have pushed gasoline above $5 per gallon in several states. Washington has attempted to leverage its strategic petroleum reserve, but the scale of supply disruption—over 3.6 billion barrels lost in March alone—has overwhelmed these measures .
China, the world’s largest oil importer, is particularly exposed. Beijing relies on the Strait for approximately 70 percent of its crude imports. With Iranian ports blockaded and alternative supply lines constrained, Chinese refiners are scrambling for replacement barrels from Russia, Central Asia, and domestic stockpiles—though at significantly higher costs .
India, the third-largest oil consumer, has seen its energy security calculus fundamentally altered. New Delhi has responded by accelerating diplomatic engagement with both Washington and Tehran while simultaneously investing in alternative infrastructure, including the India-Middle East-Europe Economic Corridor (IMEC) .
Russia occupies a unique position. While not directly dependent on Hormuz for its own energy supplies, Moscow benefits from higher global oil prices that boost export revenues. Simultaneously, Russian logistics providers are positioning themselves as alternative transit hubs for goods that can no longer move reliably through the Gulf .
The European Union faces perhaps the most severe industrial impact. With Middle Eastern petrochemical feedstocks—including naphtha, LPG, and jet fuel—disrupted, European manufacturers are experiencing raw material shortages and cost inflation. Singapore middle distillate prices have reached $290 per barrel, an all-time record, with direct consequences for European diesel and aviation fuel markets .
3. Forging New Pathways: Alternatives to the Strait
The crisis has accelerated a fundamental reimagining of global trade routes. Several alternatives are being activated or expanded:
Existing Infrastructure: Saudi Arabia’s East-West Pipeline
Saudi Arabia already possesses a critical hedge: its 1,200-kilometer East-West Pipeline, which moves oil from inland fields to the Red Sea port of Yanbu, entirely bypassing Hormuz. This infrastructure, long considered a strategic reserve, is now operating at full capacity. One Gulf energy executive described it to the Financial Times as “in hindsight, a genius masterstroke” .
The India-Middle East-Europe Economic Corridor (IMEC)
First announced at the G20 Summit in New Delhi in September 2023, IMEC has gained renewed urgency. The US-backed initiative aims to link India to Europe through an integrated network of ports, rail lines, and pipelines across the UAE, Saudi Arabia, Jordan, and Israel. According to initial estimates, IMEC’s overland transport route could reduce logistics costs by 30 percent and transit times by 40 percent compared to shipping via the Suez Canal .
The corridor would connect the UAE’s Fujairah Port—strategically located on the Gulf of Oman, outside Hormuz—to the Israeli port of Haifa on the Mediterranean. From there, goods would ship directly to European markets. Israeli Prime Minister Benjamin Netanyahu has argued that “long-term solutions include rerouting energy pipelines westward, across Saudi Arabia to the Red Sea and Mediterranean, bypassing Iran’s geographic choke point” .
The International North-South Transport Corridor (INSTC)
For Russia and its partners, the INSTC—connecting the Indian Ocean to the Caspian Sea and onward to Northern Europe—has emerged as a vital alternative. Goods move from Indian ports to Iran’s Bandar Abbas, then overland through Iran to the Caspian Sea, then by ship to Russia’s Astrakhan, and finally by rail to Europe. While this route has historically been slower and more expensive than maritime alternatives, the current crisis has made it newly competitive .
Overland Routes to Russia
For Russian importers specifically, logistics providers are pivoting to land-based corridors through Turkey, the Caucasus, and Central Asia. However, only 10-15 percent of cargo volumes have successfully shifted to these overland routes, as infrastructure struggles to handle the increased load .
4. Price and Delivery: The Calculus of Disruption
The cost implications of this logistical realignment are already evident across multiple sectors:
Oil and Energy Products
The IEA reports that March 2026 saw the largest single-month decline in global oil supply in recorded history—10.1 million barrels per day, bringing total production to 97 million barrels per day. Cumulative supply losses in March exceeded 360 million barrels, with April losses projected to reach 440 million barrels .
Brent crude is currently trading at approximately $130 per barrel, more than double pre-crisis levels. Physical crude markets have seen even more dramatic movements, with spot prices reaching $150 per barrel as refiners compete for available supply. The IEA has revised its 2026 global oil demand forecast from growth of 730,000 barrels per day to a contraction of 80,000 barrels per day—a single-month adjustment of 810,000 barrels per day—as high prices destroy demand .
Container Shipping
The Drewry World Container Index dropped 10 percent to $2,212 per 40-foot container in mid-April, reflecting a complex market dynamic. While some capacity has returned to the Suez Canal route, carriers remain divided: CMA CGM recently rerouted three services back to the Cape of Good Hope, while Maersk is resuming Suez transits for specific routes .
The diversion around the Cape of Good Hope has absorbed approximately 2 million TEUs of global container capacity—roughly 8 percent of the global fleet. As carriers gradually reintroduce capacity, freight rates are expected to fall, but analysts warn of potential 25 percent declines during 2026 even without changes in the Red Sea situation .
Russian Import Routes
For Russian businesses, the cost increases are particularly acute. Sea freight from the Middle East to Russia has more than doubled, reaching $15,000–16,000 per 40-foot container—up from approximately $6,000–7,000 before the crisis. Overland delivery from the UAE to Moscow costs 1.5 to 2 times more than maritime routes, with additional costs for delays and transshipment .
5. The Container Shipping Conundrum
Container shipping—the backbone of global manufactured goods trade—is navigating an unprecedented operational environment. The key challenge is the divergence in carrier strategies:
- Suez Route: Some carriers, including Maersk, have begun testing Suez transits for specific services, betting on improving security conditions .
- Cape Route: Others, including CMA CGM, have pulled back from the Suez, maintaining the 3,500-nautical-mile detour around Africa—adding approximately 10-14 days to Asia-Europe voyages .
This fragmentation means effective capacity is returning to the market at an “intermittent pace,” according to Drewry. The result is a highly volatile spot market, with rates on Asia-Europe trades falling 8-9 percent while trans-Pacific routes see sharper declines of 11-12 percent .
New war-risk insurance premiums for the Persian Gulf and Red Sea took effect on February 20, 2026, adding further costs to any shipping through the region .
6. Outlook: The Next 2-3 Months
The trajectory of global supply chains over the coming quarter will depend on three critical variables:
1. Diplomatic Resolution
The two-week ceasefire expires on April 22. While Pakistan, Saudi Arabia, Qatar, and Turkey are all engaged in mediation efforts, the gap between US and Iranian positions remains wide. Iran insists on the lifting of the naval blockade before further talks; the US demands Iranian compliance on nuclear enrichment and Hormuz access. A complete diplomatic breakthrough appears unlikely within the 2-3 month horizon .
2. Infrastructure Adaptation
Even under an optimistic scenario where some Hormuz traffic resumes, the crisis has permanently altered risk perceptions. Gulf states are accelerating investments in alternative export infrastructure. The GCC railway project—originally conceived in 2009 and now projected for completion around 2030—has gained new urgency. Ports in Fujairah (UAE), Duqm (Oman), and Yanbu (Saudi Arabia) are being expanded to handle diverted traffic .
3. Supply-Side Capacity
The most significant constraint is the permanent damage to Middle Eastern production infrastructure. Saudi Arabia’s Ras Tanura refinery (550,000 b/d) and the UAE’s Ruwais refinery (922,000 b/d) remain offline following drone attacks in early March. The South Pars gas field, which processes approximately 40 percent of Iran’s natural gas output, sustained damage from US-Israeli air strikes on March 18 .
The IEA notes that even if all political obstacles were removed tomorrow, “supply would not return to pre-conflict levels” due to well damage, reservoir pressure loss, and the sheer scale of required repairs. Global spare capacity is estimated at just 1.5-2.0 million barrels per day—far below the 13 million barrels per day of lost exports .
Forecast Summary
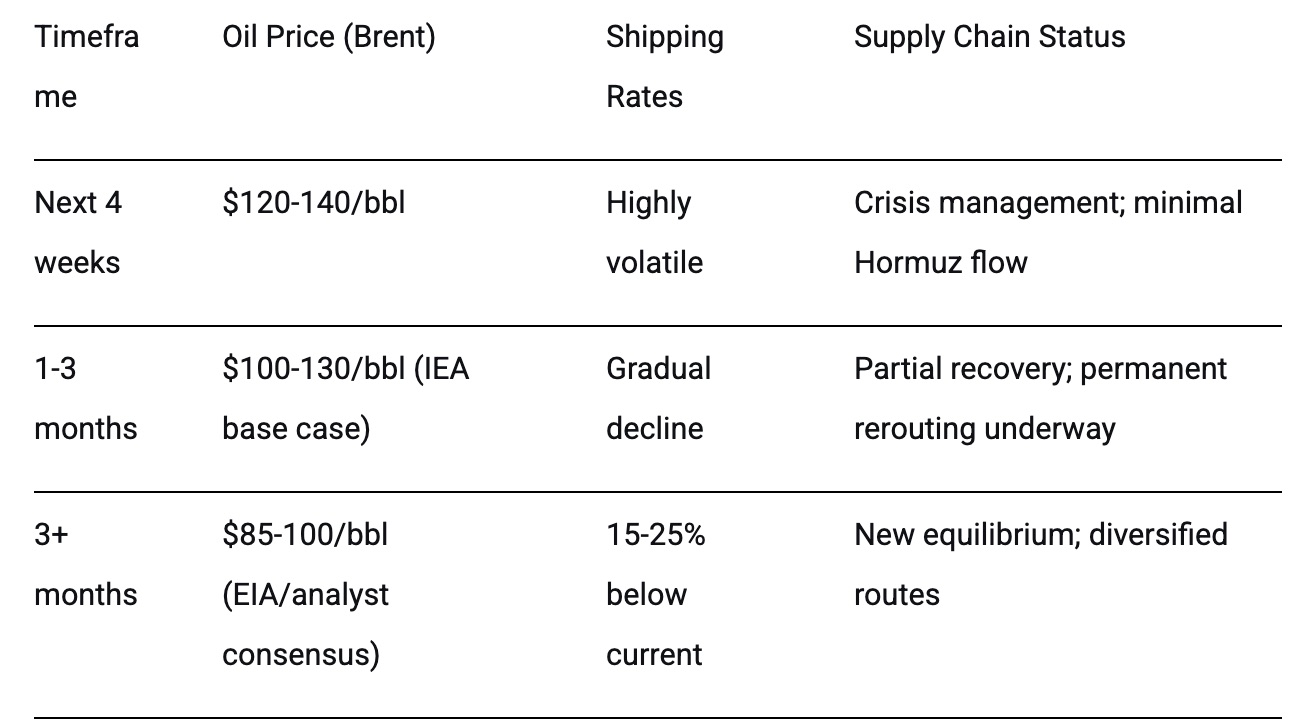
The IEA’s base case assumes Middle Eastern oil and gas exports “gradually resume” by mid-2026, but even this scenario anticipates supply remaining below pre-crisis levels. An alternative scenario—prolonged conflict—would see prices sustained above $150/bbl with severe global recessionary impacts .
Conclusion: The End of the Single-Choke point Era
The Persian Gulf crisis marks a structural break in the evolution of global supply chains—not merely a temporary disruption. What is emerging is a new paradigm characterized by redundancy over efficiency, overland corridors over maritime shortcuts, and regionalization over globalization.
For businesses, this means permanently higher logistics costs, longer lead times, and a premium on supply chain visibility. For policymakers, it underscores the strategic imperative of infrastructure diversification. And for the global economy, it represents a supply-side shock whose full effects will unfold over years, not months.
The Strait of Hormuz will eventually reopen—but the world will never again rely on it as it once did.
References and Further Reading
Primary Sources
- China Daily (April 20, 2026). Doubts cast on fresh US-Iran talks
- ET EnergyWorld (April 2, 2026). Gulf countries planning new oil routes to bypass Strait of Hormuz
- Drewry World Container Index (April 12, 2026). Shipping companies gradually restore capacity to Suez route
- International Energy Agency (April 14, 2026). Oil Market Report (OMR) – April 2026
- Izvestia (March 2, 2026). Off-road map: how the Middle East conflict is changing logistics
- Khaleej Times (April 19, 2026). Trump says US navy seized Iran-flagged cargo ship
- TRENDS Research & Advisory (February 15, 2026). Reshaping the India-Middle East-Europe Economic Corridor
- Transport Intelligence (February 24, 2026). Middle East North Africa Logistics Monitor: February 2026
- Everbright Securities (April 9, 2026). US-Iran ceasefire analysis – petrochemical sector impact
- RIA Novy Den (April 16, 2026). Alternative to Hormuz: Middle East cargo flows to Russia reorient to land routes
Logistics Route Maps (Suggested Search Terms for Visualization)
For schematic representations of current logistics routes, readers may search:
- “Strait of Hormuz shipping routes map” (U.S. Energy Information Administration)
- “IMEC corridor map 2026” (European Commission/TRENDS Research)
- “INSTC route map” (International North-South Transport Corridor)
- “Saudi Arabia East-West Pipeline map” (Saudi Aramco)
- “Cape of Good Hope vs Suez Canal distance comparison” (MarineTraffic/
PortWatch) - “Global chokepoints maritime map” (U.S. Department of Transportation)
Recommended Live Tracking
- UKMTO (United Kingdom Maritime Trade Operations) – real-time security advisories
- TankerTrackers.com – live vessel tracking in the Gulf
- IEA Oil Market Report – monthly updates on supply/demand dynamics
This analysis is based on information available as of April 22, 2026. Given the rapidly evolving situation, readers are advised to consult the primary sources listed above for the most current updates.
Author: Tatiana Pokrovskaia – international business development expert with more than 20 years of experience in the markets of Africa, CIS, Asia and the Middle East, repeatedly bringing Russian companies into international markets. Based in St. Petersburg, Russia, her work focuses on strategic partnerships, market expansion, and the promotion of innovation through the development of winning marketing strategies, essential for driving international business growth.
(The opinions expressed in this article belong only to the author and do not necessarily reflect the views of World Geostrategic Insights).
Image Source: AP